
- Akademische Forschung und Lehre
- Mitarbeiter des KIT
- Studierende des KIT (auch auf privaten Geräten)
-
Debugger DDT
-
The debugger DDT from Allinea Software is a parallel and serial debugger available for a wide range of systems. Control is mainly via mouse buttons, so there is no need to learn an extensive command language.
- Contact:
- Contact Person:
- Services:
Parallel debugger DDT
The debugger DDT from Allinea Software is a parallel and serial debugger available for a wide range of systems. It is controlled mainly by mouse buttons, so there is no need to learn an extensive command language.
The Distributed Debugging Tool (DDT) is a source-oriented, window-based debugger. DDT offers many advantages over conventional UNIX debuggers:
- The main advantage of DDT is the support for many parallel programming models including MPI and OpenMP for Fortran90/95 and C/C++ programming languages.
- DDT's graphical user interface (based on the X Window System) makes it very easy to use.
- The debugger can be assigned to already running processes.
The debugger DDT is available on the HPC systems of the SCC.
Debugging of parallel MPI programs
When using DDT on the HPC systems, the following steps must be performed:
- Compiling the program with the additional option -g
ifort -g -c myprog.f90 ! Fortran95 program
icc -g -c myprog.c /* C program */ - Creating the executable program (here: myprog) does not need any special options
mpif90 -o myprog myprog.o - Start the program under control of DDT
ddt <program>- <program>is the name of the executable program to run under control of the debugger.
After starting DDT, the "Welcome Screen" of DDT appears. Here you decide what kind of debugging you want to perform
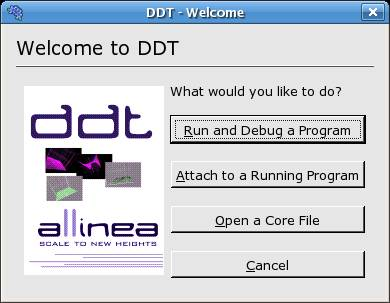
If you want to debug an executable program, choose "Run and Debug a Program".
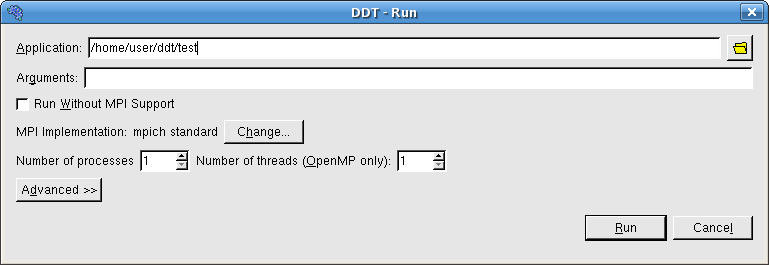
At "MPI Implementation" OpenMPI or Intel MPI should be entered, if you use the respective standard environment and want to debug a MPI program. If you want to debug a single processor program, select "none" for "MPI Implementation" in the "Run Window".
Debugging OpenMP programs
Programs parallelized by OpenMP for shared memory use can be processed with DDT in a similar way as MPI applications or serial programs. When compiling the program, the -openmp
option is also required. The translation of a Fortran program with the Intel compiler, which contains OpenMP directives, can thus be done with the following command:ifort -g -qopenmp -o my_openmp_prog my_openmp_prog.f90
The call to the debugger is then:
ddt my_openmp_prog
In the "Run Window", enter the number of threads for which you want to debug your OpenMP program.
Links to DDT
DDT Homepage atAllinea Software
.You can also use the DDT debugger locally without paying license fees by installing the debugger locally and using a small license file that lets you share the SCC's DDT license server. The license file needed for local installations can be found on the FTP server of the SCC
(ftp://ftp.scc.kit.edu/pub/campus/Allinea)
G
M
T
| Recognize languageAfrikaansAlbanianArabicArmenianAzerbaijaniBasqueBengaliBosnianBulgarianBurmeseCebuanoChichewaChinese (ver)Chinese (trad)DanishGermanEnglishEsperantoEstonianFinnishFrenchGalicianGeorgianGreekGujaratiHaitianHausaHebrewHindiHmongIgboIndonesianIrishIcelandicItalianJapaneseJavaneseYiddishKannadaKazakhCatalanKhmerKoreanCroatianLaoLatinLatvianLithuanianMalabarMalagasyMalayMalteseMaoriMarathiMacedonianMongolianNepaleseDutchNorwegianPersianPolishPortuguesePunjabiRomanianRussianSwedishSerbianSesothoSinhaleseSlovakSlovenianSomaliSpanishSwahiliSundaneseTajikTagalogTamilTeluguThaiCzechTurkishUkrainianHungarianUrduUzbekVietnameseWelshBelarusianYorubaZulu | AfrikaansAlbanianArabicArmenianAzerbaijaniBasqueBengaliBosnianBulgarianBurmeseCebuanoChichewaChinese (ver)Chinese (trad)DanishGermanEnglishEsperantoEstonianFinnishFrenchGalicianGeorgianGreekGujaratiHaitianHausaHebrewHindiHmongIgboIndonesianIrishIcelandicItalianJapaneseJavaneseYiddishKannadaKazakhCatalanKhmerKoreanCroatianLaoLatinLatvianLithuanianMalabarMalagasyMalayMalteseMaoriMarathiMacedonianMongolianNepaleseDutchNorwegianPersianPolishPortuguesePunjabiRomanianRussianSwedishSerbianSesothoSinhaleseSlovakSlovenianSomaliSpanishSwahiliSundaneseTajikTagalogTamilTeluguThaiCzechTurkishUkrainianHungarianUrduUzbekVietnameseWelshBelarusianYorubaZulu |
The sound function is limited to 200 characters